Chartit360 - AI-Driven Financial Analytics
An intuitive, enterprise-grade data analytics platform. A complete solution for advanced AI-driven financial insights, forecasts, and real-time dashboards.
Visit website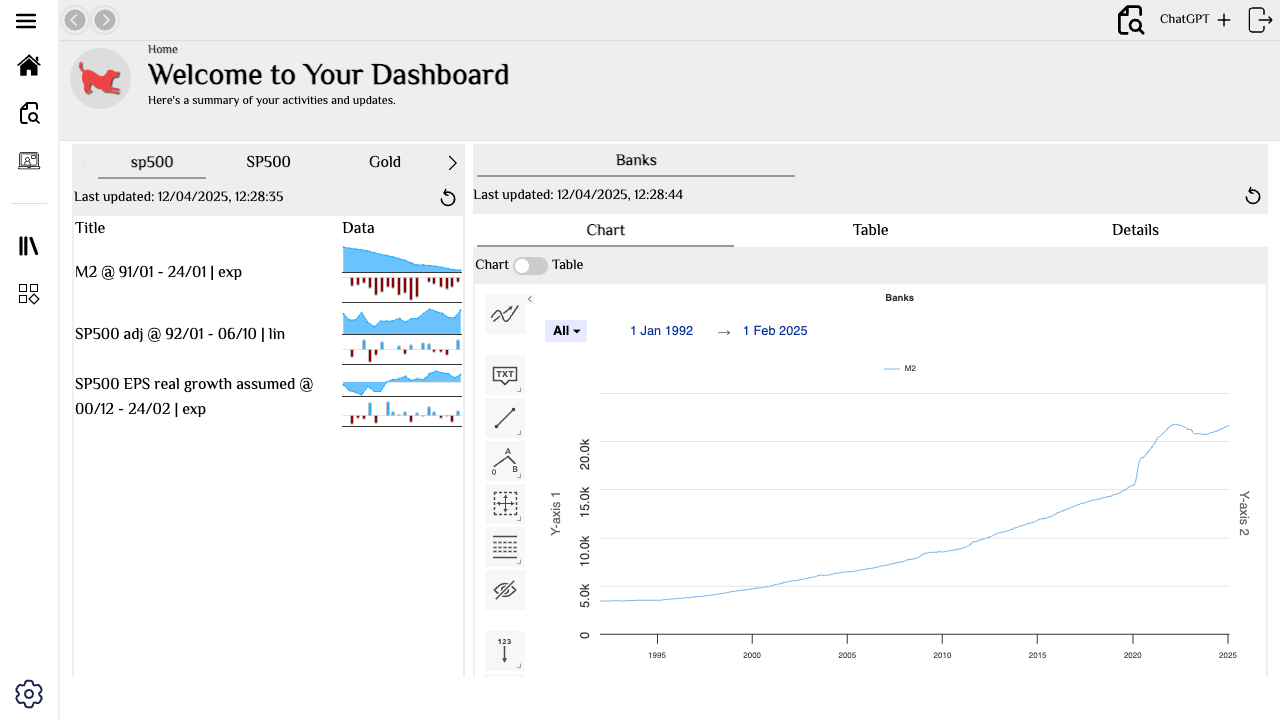
Clear & Extensive Dashboard UI
Chartit360's intuitive dashboard provides a comprehensive overview of your financial data with a clean, extensive interface that enables quick navigation and efficient data management. The thoughtfully designed UI makes complex financial information accessible and actionable.
AI-Powered Capabilities
Our advanced AI engine processes financial data to identify patterns, predict market movements, and offer actionable insights that would be impossible to derive manually. Chartit360's machine learning algorithms continuously improve, making your financial analytics smarter over time.
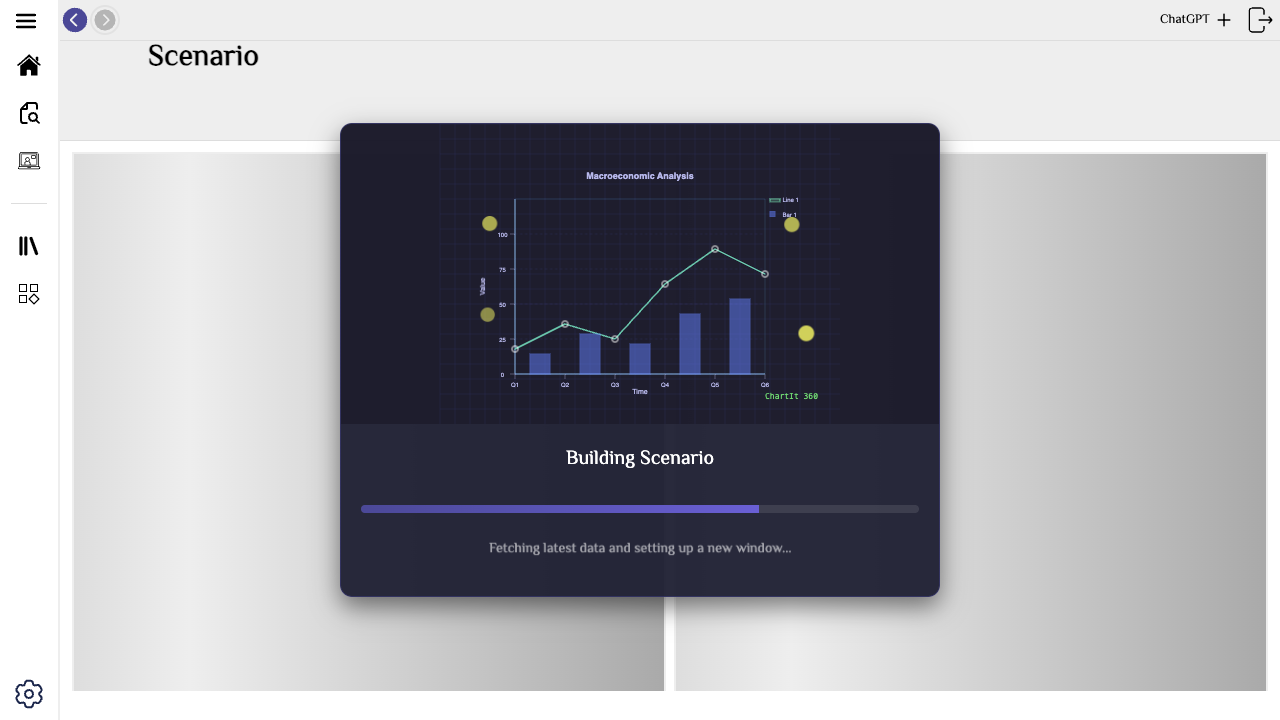
Smooth, Intuitive Experience
Chartit360 delivers a frictionless user experience that feels natural and responsive. The platform's thoughtful design reduces complexity and cognitive load, allowing users to focus on financial insights rather than wrestling with complicated interfaces.
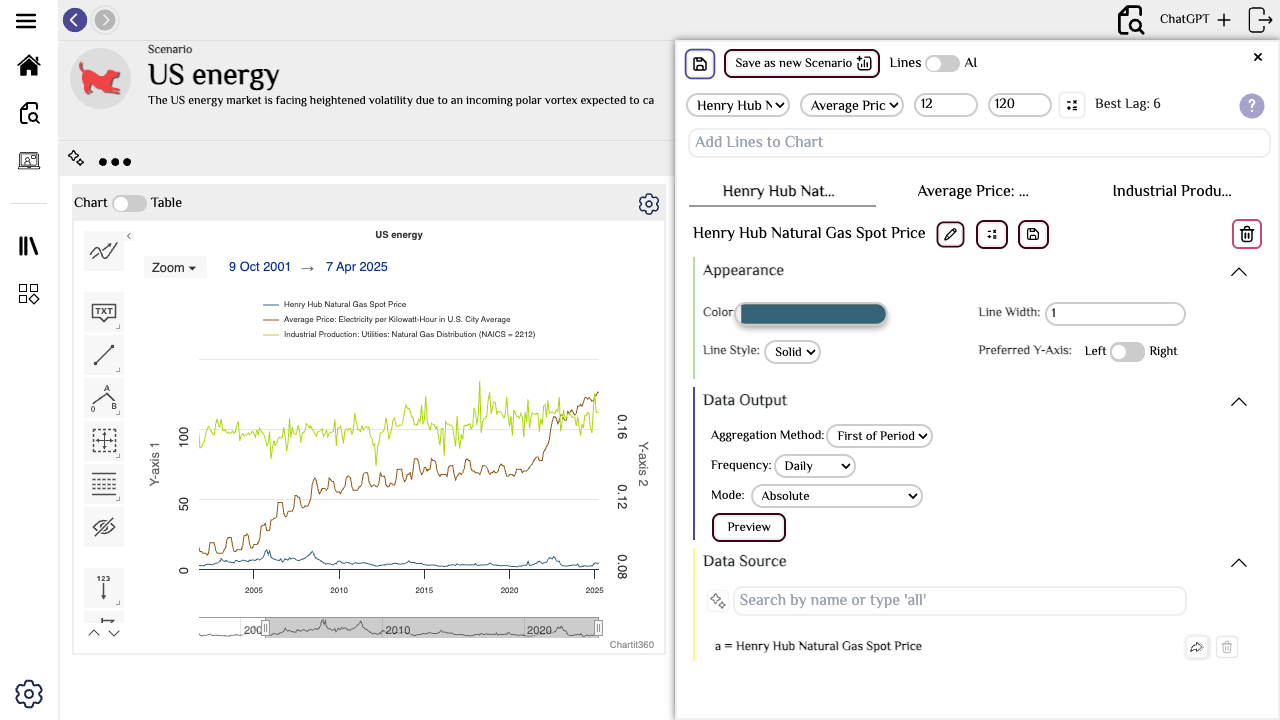
Versatile Toolset
Access a comprehensive suite of financial tools designed to handle everything from basic analytics to complex scenario modeling. Chartit360's versatile toolkit adapts to your specific needs, whether you're a financial analyst, business executive, or industry specialist.
Multi-User Collaboration
Leverage Chartit360's Channels feature for seamless team collaboration. Create dedicated workspaces for different projects, departments, or clients, with customizable permissions and real-time collaboration tools that keep everyone on the same page.
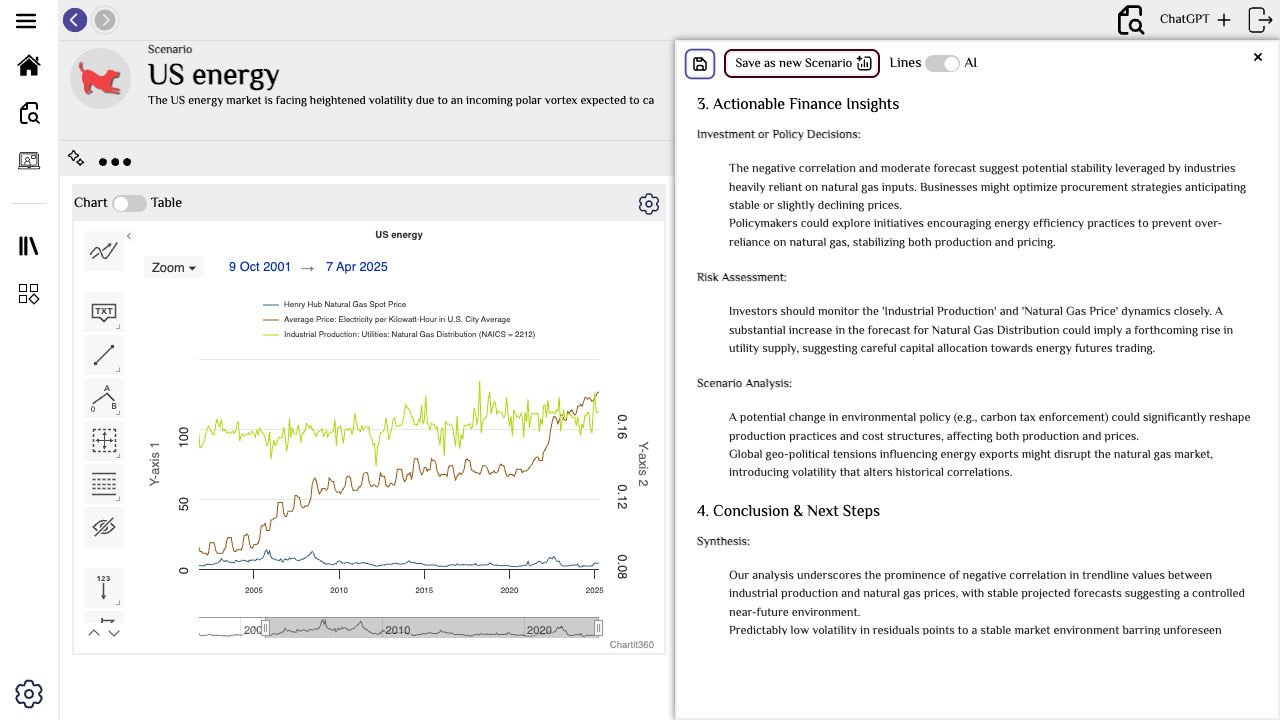
Advanced Data Visualization
Transform complex datasets into compelling visual stories with Chartit360's advanced visualization capabilities. From interactive charts and graphs to custom dashboards, our AI-enhanced visualization tools make it easy to communicate insights effectively to stakeholders at all levels.
Custom Reporting
Create custom reports tailored to your exact specifications. Whether you need detailed quarterly financial statements, budget comparisons, or executive summaries, Chartit360's reporting engine can generate clear, visually compelling reports ready to share with stakeholders.
Security & Compliance
Rest easy knowing your financial data is protected by enterprise-grade security. Chartit360 is fully compliant with industry regulations and employs state-of-the-art encryption, access controls, and regular security audits to safeguard your information.
What People Are Saying
Don't just take our word for it. Here's what real users are saying about Chartit360.
"The technical depth behind Chartit is seriously impressive. It's clear a lot of thought went into making it robust, yet accessible."
Alex @alex
"Chartit has completely streamlined how we approach analysis. It's intuitive, but powerful enough to handle complex scenarios that Excel simply can't."
Alexey @alexey
"The range of built-in tools and AI-driven insights is game-changing. We've drastically reduced time spent on manual calculations."
Andrey @andrey